Origin: How it all began
We can detect the origin of the credit crisis in the period ranging from early 2007 to early 2008, until the Bear Stearn implosion.
"The impact on the broader economy and financial markets of the problems in the subprime markets seems likely to be contained" (Ben Bernanke, April 2007)
The crucial rupture of the virtuous circle came when rising defaults among <?xml:namespace prefix = st1 ns = "urn:schemas-microsoft-com:office:smarttags" />US subprime mortgage holders undermine the rationale for the overwhelming expansion of the credit.<?xml:namespace prefix = o />
Back-End: Easier credit conditions extended cash to unreliable borrowers, previously unable to buy properties.
Front-End: Cheap money encouraged investors to search for high yields through buying new asset classes.
In the middle stands the fast-growing securitization market (between 2000 and 2006 nominal issuance of credit instruments increase twelvefold from$250bn to $3tn) and the financial innovation, involving: Underwriters; Asset Managers; Administrator and accountants; Attorneys and law firms; Mortgage agencies; Rating agencies; Funds (investments, banks, pensions, insurances, hedges, trusts); Academics.
Credit Bubble
The innovative idea coming forward in the credit market was slicing and dicing and had the name of CDO, Collateral Debt Obligation.
Many players were involved in the slicing and dicing process of big credit nominal amounts.
This process fuelled the credit bubble and led to artificially low borrowing costs, spiralling leverage and easing lending standards. At the end of the 80s Emmanuel Derman argued that "the process of asset acquisition, pooling, standardization and final sale provides a liquidity that frees the savings banks to make more and more loans".
The founding assumption was the mitigation of credit risk due to its dispersion among millions of investors: it will be easier for the system to absorb any credit shock.
The hidden hypothesis is that the credit risks remain correlated at the same (quite low) level as they are during normal times. This has not been the case.
This brief article on CDOs depicts the grounds of the surge and the embedded risks of these instruments.
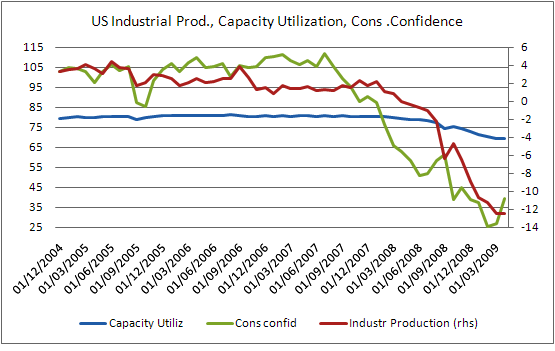
Key economic indicators for the US economy
Let's start with either standard and fundamental measures like industrial production, output gap and consumers' confidence.
Current Account deficit trend
The difficult and nuanced theme of global imbalances starts from the US' huge current account deficit and follows with the Chinese surplus. This issue is reflected in the Treasury notes and bills, held in large part by China and in the Dollar.
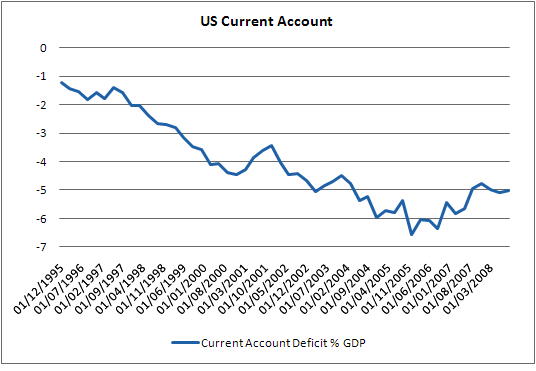
The improvement in the US current account is mostly cyclical and so far oil prices have driven most of the adjustment in the excess savings of emerging countries , but the king of global imbalances still remains to be fixed.
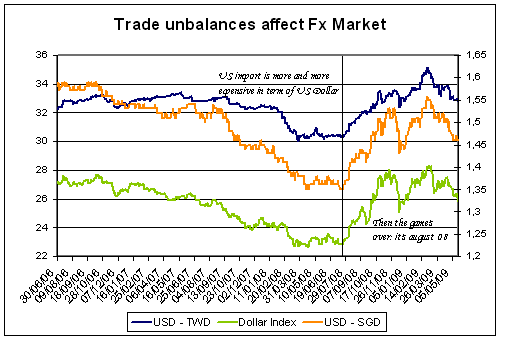
Fx Market: US Dollar vs Asian currencies
In times of huge trade unbalances for the US economy, particularly versus high surplus economies, the dollar has been the preferred lever for chilling imports and financing exports. The trend seemed unstoppable, but an iceberg was sealing that sea.
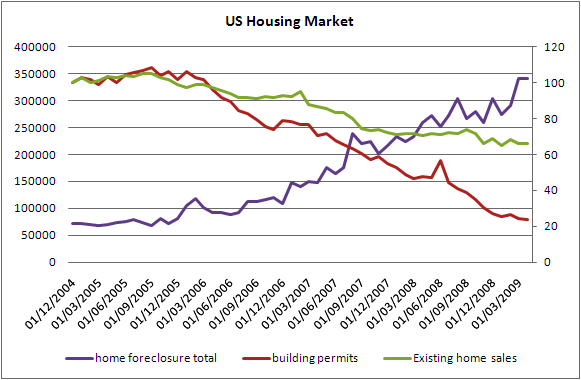
Housing market
US Housing market experienced a bubble, like Japan in the '90s. Continuously increasing houses' value provided an erroneous perception of household wealth and gave borrowing access to subprime individuals: lenders virtually hedged the risk following the conviction that foreclosure money more than offset lended money. Unfortunately, this theory began to unravel in mid 2006.
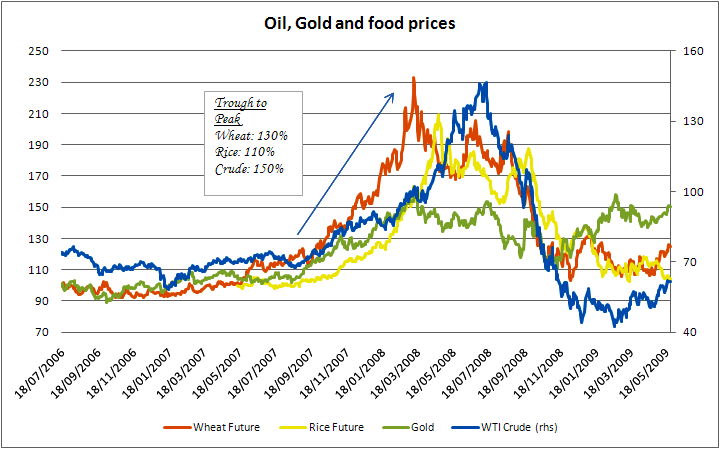
Oil, Gold and Food prices high voltage
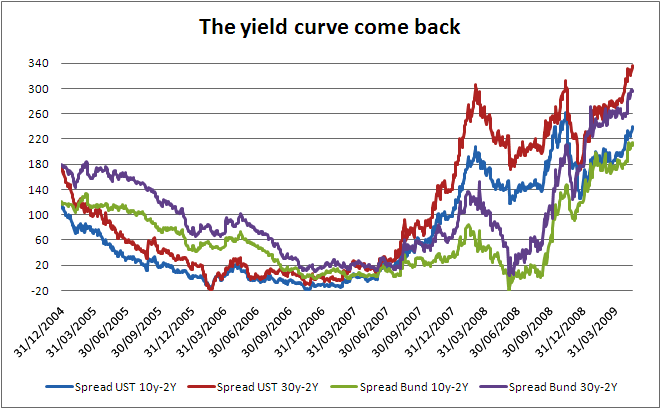
Interest rates
Yield curves in many developed countries up to summer 2007 were quite flat: where are the inflation expectations? Which is the risk of inflation?
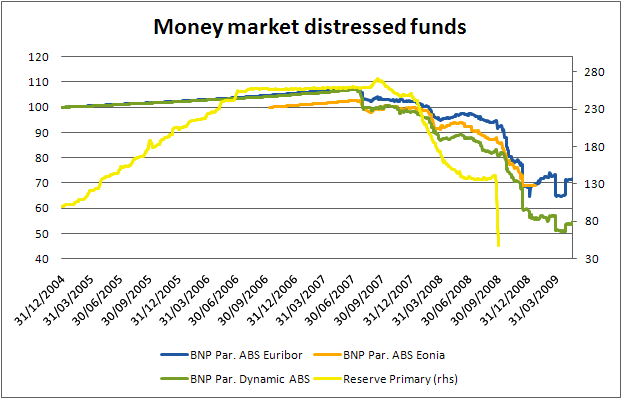
Credit ease: the money market
The promise of low interest rates for a long time implicit in the US expansionary monetary policy, reflecting low equilibrium world rates, lead to a "rush for the yield" even by not-so-greedy investors. Money Market funds also bought increasing percentages of risky assets, thus both satisfying their appetite and undervaluating the potential downside. The preferred risky assets were ABS and derivatives on them.
During the summer of 2007, BNP Paribas suspended Nav calculation for three money market funds and halted redemptions. In the US, Reserve Primary funds suffered an impressive slide: its story then ended in October 2008.